A Shorter Path to Value
Disco's core product is DiscoFeed, a showcase of complementary products and brands consumers see after completing a purchase with a partner brand.
A big usability issue with DiscoFeed is that it can take 1-3 months for new brands to start seeing impressions and results. This long lead time makes it hard to prove the value of Disco to new customers.
Our mission with this project was to use the data we had from our existing brand ecosystem to show new users compelling performance and audience information that they could take immediate action on while they waited for the DiscoFeed to get up and running.

Research
Interview Disco partner brand reps to find out whether we can tell a compelling story with the aggregated data from the brands on our network. We also needed to find out what specific actions customers might take using the data.
Key Insights
Reporting use case
We focused our target use cases on strategic adjustments, but during interviews, we found many users wanted to take screenshots or export the surfaces for quarterly reports and other internal presentations.
Competing with existing analytics tools
Some users from larger organizations expressed interest in piping this information into their existing analytics tools. While we wanted to enable this, we also wanted to make sure we still gave users a reason to log in to Disco to discover and take advantage of additional product offerings and upsells.
Solution #1: Aggregate partner brand data for useful benchmarks and trends
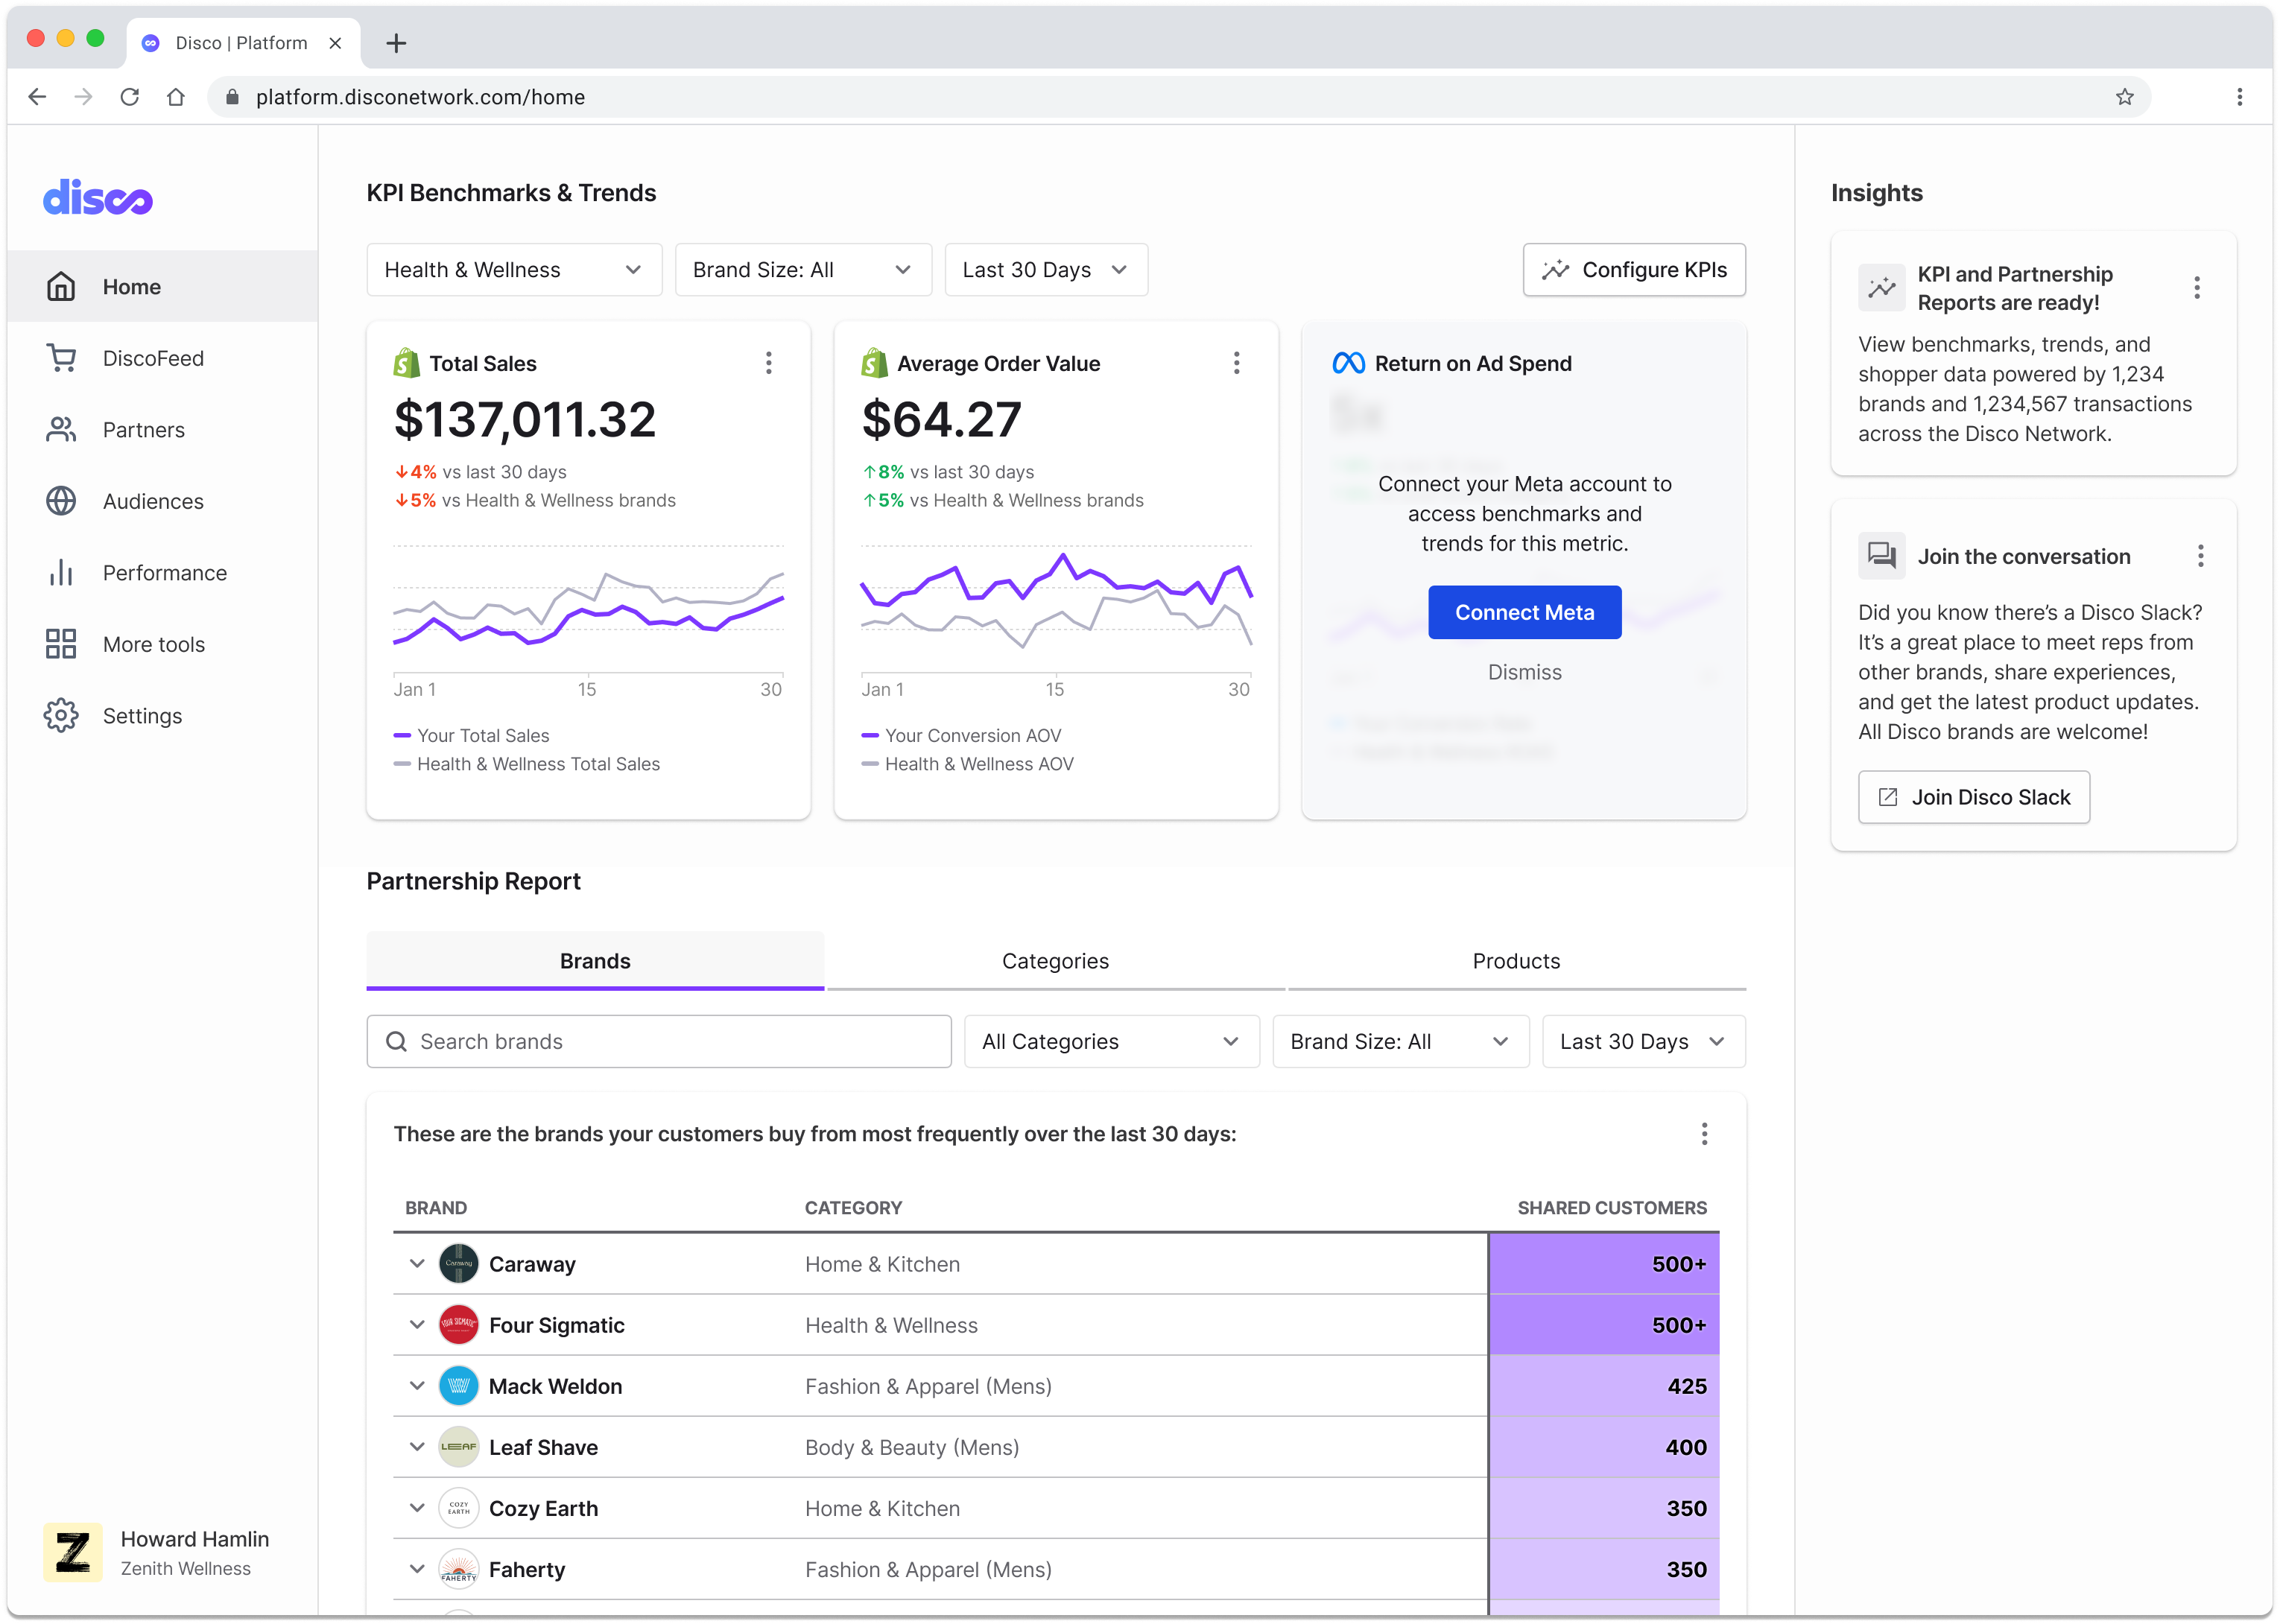
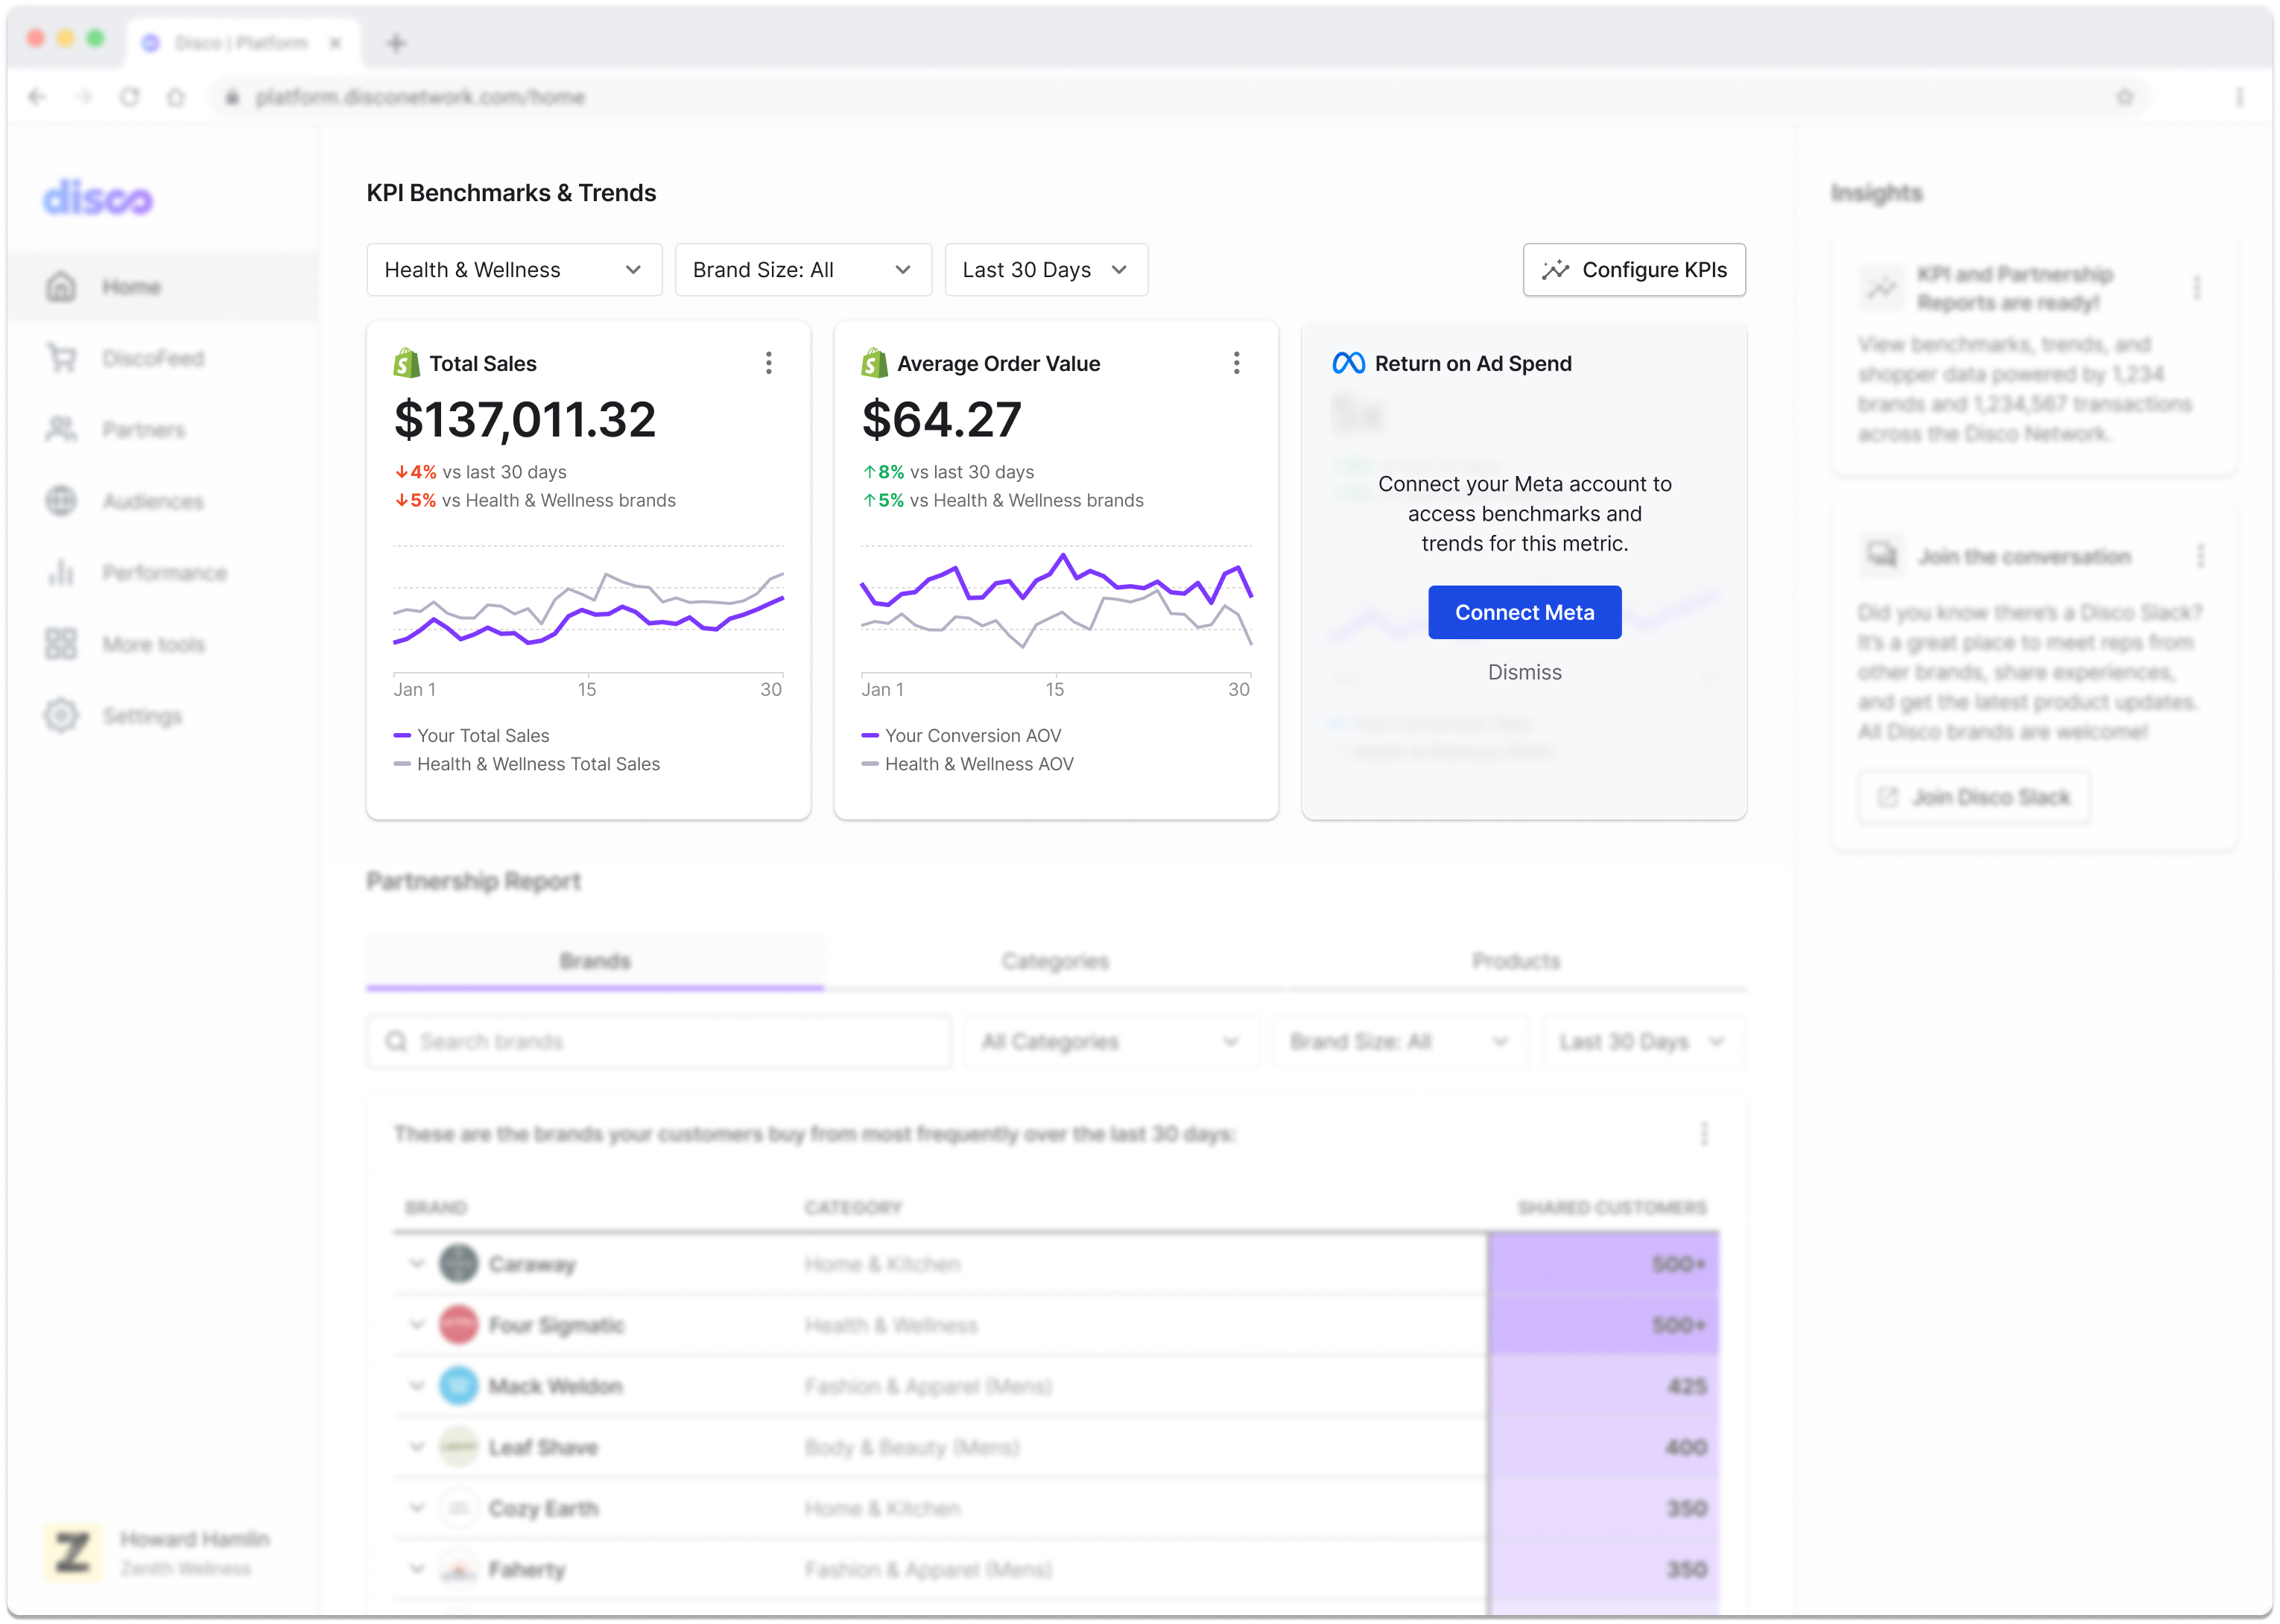
Benchmarks and trends are dyanmic data points that help users measure how they're performing compared to other brands in their category. They can also see whether a spike or dip is specific to their shop or a wider trend that everyone is seeing.

Solution #2: Show customer overlap for strategic partnership opportunities
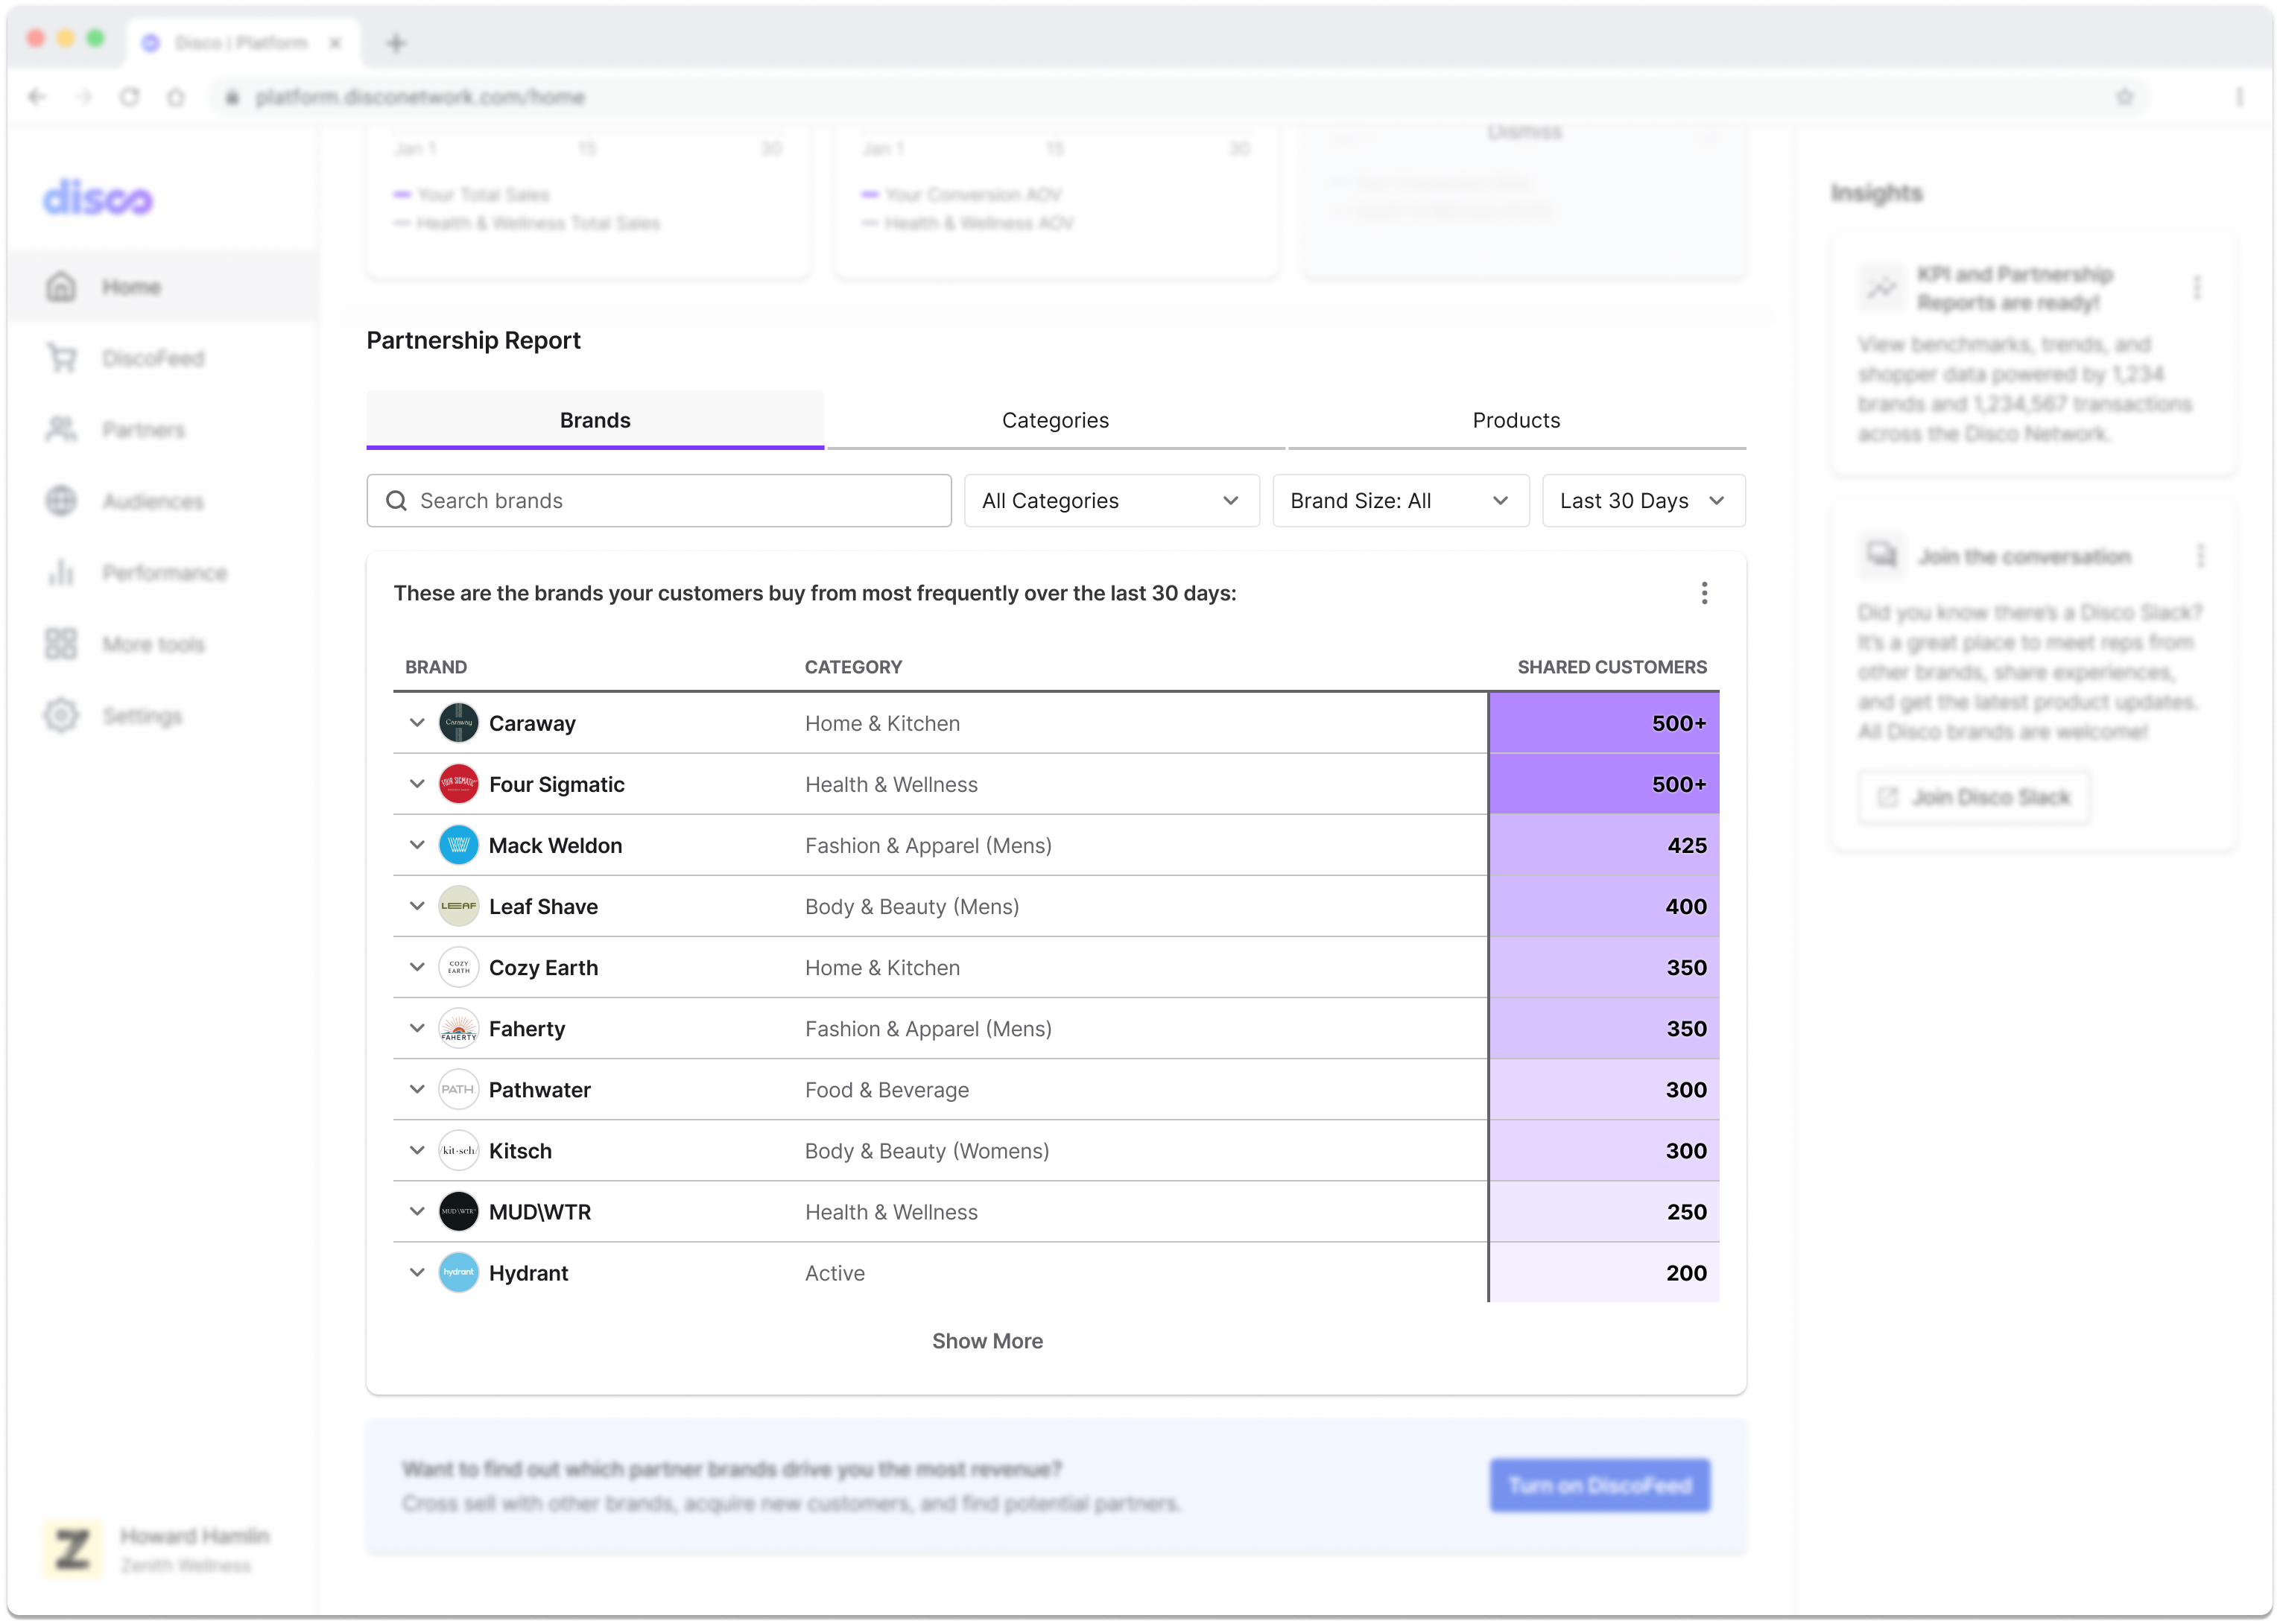
The partnership report shows users customers they share with other brands, categories, and products on the Disco Network. Disco brands can use this information to identify partner marketing opportunities, target audiences from complimentary categories, and learn more about their customers based on products they purchase from other brands.

Impact
User Success Rate
Most users (23/25) completed workflows to add metrics, create audiences, etc with no assistance.
User Satisfaction
All users expressed excitement with both solutions and listed specific actions they would take with the data.